Page 20 - Professional Parquet July 2013
P. 20
MARKET THE SURVEY
Parquet production in Europe
Production and consumption development compared to 2011
been able to maintain its third position with 9.32%. The largest Parquet consumer per capita is Austria (0.88 m2), followed by Switzerland (0.73 m2) and Sweden (0.66 m2). In total FEP region, the consumption per capita has lost a point and stood at 0.22 m2. As for the production subdivided by countries, in absolute terms, Poland con- solidates its position as the top produc- er with 18.97%, Germany still ranks in the second place (15.24%) and Sweden on the third (13.3 %). Italy is at a standstill in 4.3% of the total.
Speaking of wood species, oak gained further ground (with a percentage of 70%), tropical woods are still falling (- 6.2%). Ash and beech woods are the two most used wood species after the oak, re- spectively with 6.5% and 6.1%.
Moving on to the formats, the picture is similar to that of the last two years: the stratified has 78% of the quotas, the sol- id parquet has 20% (the mosaic has re- mained at 2%).
And the future?
"In an economic situation where even the leading financial institutions and the Eu- ropean Commission adjust their predic- tions practically every week, it is almost impossible to predict developments in the industry in the coming years - said the president of FEP -. Anyway I do not ex- pect a recovery before three years."
1985
1986
1987
1988
1989
1990
1991
1992
1993
1994
1995
1996
1997
1998
1999 (*)
2000
2001
2002
2003
2004
2005
2006
2007
2008
2009
2010
2011
2012
000 m2
23.300
25.580
26.991
29.997
34.566
35.634
35.294
37.977
40.396
44.972
49.798
50.578
53.836
58.308
64.774
69.812
75.621
76.741
81.039
91.453
95.977
97.911
100.334
84.725
67.523
70.500
71.630
68.266
+ / - %
9,79 %
5,52 %
11,14 %
15,23 %
3,09 %
-0,95 %
7,60 %
6,37 %
11,33 %
10,73 %
1,57 %
6,44 %
8,31 %
11,09 %
7,78 %
8,32 %
1,48 %
5,60 %
12,85 %
4,95 %
2,02 %
2,47 %
-15,56 %
-20,30 %
4,41 %
1,60 %
-4,70 %
000 m2
AT
BE
CH
CZ
DE
ES
FR
HU
IT
NL
PL
RO
SK
DK/FIN/NO
SE
FEP
Production
0,47 %
3,93 %
-15,87 %
-6,90 %
0,51 %
-10,08 %
-3,85 %
-10,54 %
-14,96 %
-3,59 %
4,02 %
0,00 %
-13,15 %
-30,07 %
-3,15 %
-4,70 %
Consumption
1,97 %
0,41 %
-0,65 %
-25,94 %
1,55 %
-25,75 %
-4,24 %
-10,58 %
-15,00 %
-17,49 %
-1,73 %
0,0 %
-5,97 %
-5,13 %
-6,89 %
-5,88 %
* Total market in Fep area
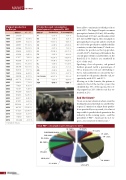
Total FEP consumption percentages for 2012
SE 7,26%
AT 8,52%
DK/FIN/NO 8,08%
RO 2,32% PL 5,20%
NL 1,80%
IT 9,32%
HU 0,32%
FR 14,32%
BE 3,63%
CH 6,66%
CZ 1,13%
DE 23,98%
ES 7,47%
20