Page 13 - Parquet International luglio 2014
P. 13
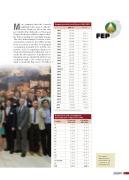
More optimistic than the forecasts published on the occasion of the Do- motex Hannover Show, the data provided by Fep (Federation of European Parquet Producers) affiliates depict a mar- ket that has undergone only slight changes. The outlook that emerges, however, is char- acterized by situations that differ widely from one nation to another. Total parquet consumption shrank by 2.6% in 2013 com- pared to 2012. As regards production, in- stead, the trend already evident last year to- wards the delocalization of production to European nations outside Fep territory was confirmed, with a 1.81% decrease in pro- duction inside the Fep area to 67 million
Parquet production in Europe 1985-2013
000 m2 + / - %
1985 23.300
R
1986
1987
1988
1989
1990
1991
1992
1993
1994
1995
1996
1997
1998
1999 (*)
2000
2001
2002
2003
2004
2005
2006
2007
2008
2009
2010
2011
2012
2013
25.580
26.991
29.997
34.566
35.634
35.294
37.977
40.396
44.972
49.798
50.578
53.836
58.308
64.774
69.812
75.621
76.741
81.039
91.453
95.977
97.911
100.334
84.725
67.523
70.500
71.630
68.266
67.027
9,79 %
5,52 %
11,14 %
15,23 %
3,09 %
-0,95 %
7,60 %
6,37 %
11,33 %
10,73 %
1,57 %
6,44 %
8,31 %
11,09 %
7,78 %
8,32 %
1,48 %
5,60 %
12,85 %
4,95 %
2,02 %
2,47 %
-15,56 %
-20,30 %
4,41 %
1,60 %
-4,70 %
-1,81%
(*) As of figures show represent total market in Fep area
Production and consumption development compared to 2013
Country
AT
BE
CH
CZ
DE
ES
FR
HU
IT
NL
PL
RO
SK
DK/FIN/NO
SE
FEP
Production 2013/2012
0,00 %
-13,33 %
16,78 %
0,00 %
-0,23 %
-0,69 %
-5,80 %
-6,27 %
-10,50 %
5,40 %
2,55 %
3,06 %
-9,06 %
-22,56 %
-3,30 %
-1,81 %
Consuption 2013/2012
0,63 %
1,36 %
10,16 %
3,55 %
-5,80 %
-14,32 %
-7,42 %
62,01 %
-4,90 %
-0,60 %
-10,11 %
26,07 %
2,56 %
5,56 %
-0,79 %
-2,60 %
The market data released
at the latest Fep Conference are provided below
13