Page 14 - Parquet International luglio 2014
P. 14
MARKET
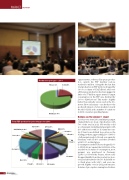
Production per type - 2013
Mosaic 2% Solid 20%
Multilayer 78%
Total FEP production percentages for 2013
SE 13,10%
AT 12,35%
DK/FIN/NO 4,48%
RO 3,36%
PL 19,81%
NL 2,16%
BE 0,58%
CH 2,61%
CZ 2,01%
DE 15,48%
ES 6,84%
IT 4,40%
HU 2,53%
FR 10,29%
THE SURVEY
square meters, whereas European produc- tion outside the FEP member nations reached 10 million. Alongside the fact that total production in FEP territory dropped by 1.8% to a volume of 67,027,450 m2, total over- all European production has been pegged at little over 77 million square meters. Parquet consumption in the FEP area declined by 2.6% to 82,681,000 m2. This result – slightly better than initially envisioned at the Do- motex Show in January – can be due to the good performance of a few markets towards the end of 2013 and a number of variations in 2012 consumer spending figures.
Nations on the winners’ stand
As it has ever since 2010, multilayer parquet claimed the lion’s share of production with 78% of the total in 2013, followed by solid wood parquet (including lamparquet) with 20% and mosaic with 2%. Country by coun- try, Poland consolidated its position as the leading producer, approaching 20% (19.81%) of all parquet made, followed once again by Germany with 15.48% and then Sweden with 13.1% in third place.
Consumption in the FEP area dropped 2.6% to 82,681,000 m2 against the 84,888,000 of the year before. In terms of consumption, most parquet was purchased in Germany (23.91%), followed by France, where sales dropped slightly from the year before, how- ever, and amounted to 14.03%. Italy held on- to third place with 9.39% and even im- proved slightly over its 2012 performance. In terms of pro-capita consumption, Switzer-