Page 7 - PQ-International
P. 7

FEP_ing_2017:Layout 1  20-07-2017  10:59  Pagina VII


                                                                                                                                             INTERNATIONAL


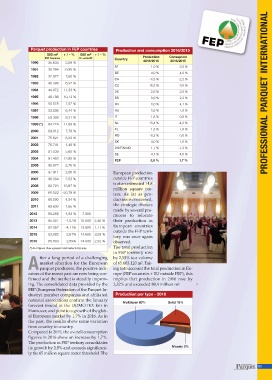
                      Parquet production in FEP countries        Production and consumption 2016/2015
                               000 m 2  + / - %  000 m 2  + / - %
                              FEP Countries    EU - outside FEP  Country      Production    Consuption
                      1990     35.634   3,09 %                                 2016/2015    2016/2015
                                                                AT                1,0 %          2,0 %
                      1991     35.294  -0,95 %
                                                                BE                4,0 %          4,0 %
                      1992     37.977   7,60 %
                                                                CH                -3,3 %        -2,2 %
                      1993     40.396   6,37 %
                                                                CZ                18,3 %         3,6 %
                      1994     44.972  11,33 %
                                                                DE                2,6 %          2,5 %                                       PARQUET
                      1995     49.798  10,73 %                  ES                0,9 %          2,2 %
                      1996     50.578   1,57 %                  FR                3,0 %          4,1 %
                      1997     53.836   6,44 %                  HU                3,5 %          1,0 %
                      1998     58.308   8,31 %                  IT                1,8 %          0,8 %
                      1999 (*)  64.774  11,09 %                 NL                13,4 %        -4,2 %
                                                                PL                1,3 %          1,8 %
                      2000     69.812   7,78 %
                                                                RO                -0,2 %         0,0 %
                      2001     75.621   8,32 %
                                                                SK                4,0 %          1,6 %
                      2002     76.741   1,48 %                                                                                               PROFESSIONAL
                                                                DK/FIN/NO         1,1 %         -1,2 %
                      2003     81.039   5,60 %
                                                                SE                4,7 %          4,0 %
                      2004     91.453  12,85 %
                                                                FEP               2,5 %          1,7 %
                      2005     95.977   2,76 %
                      2006     97.911   2,06 %                  European production
                      2007     98.334   2,53 %                  outside FEP countries
                                                                is at an estimated 14,8
                      2008     82.724  -15,87 %
                                                                million square me-
                      2009     65,522  -20,79 %
                                                                ters. As far as pro-
                      2010     68.500   4,54 %                  duction is concerned,
                                                                the strategic choices
                      2011     69.630   1,65 %
                                                                made by several pro-
                      2012     66.266  -4,83 %  7.000
                                                                ducers to relocate
                      2013     65.027   -1,87%  10.000  2,40 %  their production in
                                                                European countries
                      2014     62.357   -4,11%  13.500  1,11 %
                                                                outside the FEP terri-
                      2015     63.982   2,61%  14.600  3,59 %
                                                                tory was once again
                      2016     65.603   2,53%  14.800  2,32 %   observed.
                      (*) As of figures show represent total market in Fep area  The total production
                                                                in FEP territory rose
                           fter a long period of a challenging  by 2,53% to a volume
                           market situation for the European    of 65.603.120 m². Tak-
                     A parquet producers, the positive indi-    ing into account the total production in Eu-
                     cators of the recent past are now being con-  rope (FEP countries + EU outside FEP), this
                     firmed and the market is steadily improv-  implies that production in 2016 rose by
                     ing. The consolidated data provided by the  2,32% and exceeded 80,4 million m².     R
                     FEP (European Federation of the Parquet In-
                     dustry) member companies and affiliated     Production per type - 2016
                     national associations confirm the January
                                                                     Multilayer 80%        Solid 18%
                     forecast issued at the DOMOTEX fair in
                     Hannover, and point to a growth of the glob-
                     al European market by 1,7% in 2016. As in
                     the past, the results show some variation
                     from country to country.
                     Compared to 2015, the overall consumption
                     figures in 2016 show an increase by 1,7%.
                     The production in FEP territory consolidates
                     its growth by 2,5% and exceeds significant-                             Mosaic 2%
                     ly the 65 million square meter threshold. The


                                                                                                                                        VII
   2   3   4   5   6   7   8   9   10   11   12