
Page 8 - PQ-International
P. 8
FEP_ing_2017:Layout 1 20-07-2017 11:00 Pagina VIII
MARKET ANALYSIS
Consumption in the FEP area improved by
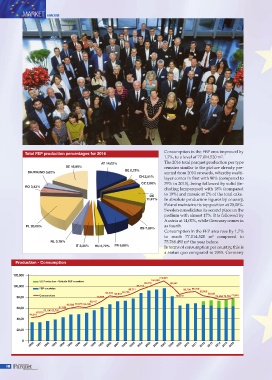
Total FEP production percentages for 2016
1,7%, to a level of 77.014.520 m².
AT 14,02% The 2016 total parquet production per type
SE 16,99% remains similar to the picture already pre-
BE 0,72%
DK/FIN/NO 3,62% sented from 2010 onwards, whereby multi-
CH 2,51%
layer comes in first with 80% (compared to
CZ 2,06% 79% in 2015), being followed by solid (in-
RO 3,43%
cluding lamparquet) with 18% (compared
to 19%) and mosaic at 2% of the total cake.
DE
11,97% In absolute production figures by country,
Poland maintains its top position at 20,08%.
Sweden consolidates its second place on the
podium with almost 17%. It is followed by
Austria at 14,02%, while Germany comes in
PL 20,08% as fourth.
ES 7,29%
Consumption in the FEP area rose by 1,7%
to reach 77.014.520 m² compared to
NL 3,19% 75.768.490 m² the year before.
IT 3,35% HU 2,72% FR 8,06% In terms of consumption per country, this is
a status quo compared to 2015. Germany
Production - Consumption
120,000
110,221
104,992
UE Production - Outside FEP countries
99,279 99,547
100,000 96,713
FEP countries 89,711 89,780 90,100
84,303 82,972 84,758 82,888 80,681
Consumption 85,019 77,015
80,00 74,888 75,404 75,768
68,167
62,580 64,676 63,728
60,00 57,938
52,180 52,720
47,070
44,910
40,00
20,00
0
1990 1991 1992 1993 1994 1995 1996 1997 1998 1999 2000 2001 2002 2003 2004 2005 2006 2007 2008 2009 2010 2011 2012 2013 2014 2015 2016
VIII