
Page 15 - International Parquet
P. 15
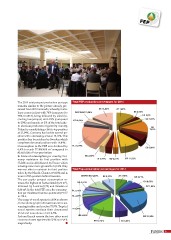
The 2014 total parquet production per type      Total FEP production percentages for 2014

remains similar to the picture already pre-

sented from 2010 onwards, whereby multi-                          SE 14,84%    AT 11,9%

layer comes in first with 76% (compared to      DK/FIN/NO 3,36%                                           BE 0,62%
                                                                                                                      CH 2,8%
78% in 2013), being followed by solid (in-                                                                                 CZ 1,97%

cluding lamparquet) with 22% (compared          RO 3,51%                                                                           DE
                                                                                                                                 13,9%
to 20%) and mosaic at 2% of the total cake.

In absolute production figures by country,

Poland is consolidating a bit its top position

at 21,04%, Germany has lost its second po-

sition with a decreasing score at 13,19%. This

position has been taken by Sweden which

completes the usual podium with 14,84%.

Consumption in the FEP area declined by         PL 21,04%

6,4% to reach 77.358.400 m2 compared to                                                                    ES 6,86%

82.681.000 m2 the year before.

In terms of consumption per country, Ger-                  NL 2,55%
                                                                             IT 3,44% HU 2,81%
many maintains its first position with                                                          FR 11,02%

23,34% and is still followed by France which

is losing some more ground to 12,13%. Italy

was not able to maintain its third position     Total Fep consumption percentages for 2014

taken by the Nordic Cluster at 9,63% and is

now in fifth position behind Sweden.                 DK/FIN/NO 9,63% SE 8,32%  AT 7,98%                   BE 2,71%
                                                RO 3,31%                                                               CH 8,05%
The per capita parquet consumption re-                                                                                     CZ 1,25%

mains the highest in Switzerland (0,76 m2),

followed by Austria (0,73) and Sweden at

0,66 m2. In the total FEP area, the consump-    PL 5,11%
                                                NL 2,45%
tion per inhabitant lost two points at 0,19 m2

in 2014.

The usage of wood species in 2014 as shown

on the above graph indicates that oak is ad-

vancing further and reaches 73,9%. Tropical

wood species continue their downward            IT 8,24%
                                                        HU 0,59%
trend and now show a mere 4,5%.

Ash and beech remain the two other most                                                                    DE 23,34%

common chosen species with 5,4% and 4,4%                          FR 12,13%                     ES 6,89%

respectively.                         I

                                                                                                                                        15