
Page 13 - International Parquet
P. 13
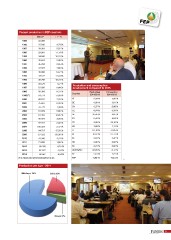
Parquet production in FEP countries

1985            000 m2                                     +/-%       Production and consumption
1986             23.300                                               development compared to 2015
1987             25.580                                      9,79 %
1988             26.991                                      5,52 %   Country    Production  Consuption
1989             29.997                                     11,14 %              2014/2013    2014/2013
1990             34.566                                     15,23 %
1991             35.634                                      3,09 %   AT         -9,99 %            -5,00 %
1992             35.294                                     -0,95 %
1993             37.977                                      7,60 %   BE         0,00 %             -3,01 %
1994             40.396                                      6,37 %
1995             44.972                                     11,33 %   CH         0,37 %             -2,96 %
1996             49.798                                     10,73 %
1997             50.578                                      1,57 %   CZ         -8,89 %            -5,39 %
1998             53.836                                      6,44 %
1999 (*)         58.308                                      8,31 %   DE         -20,45 %           -8,65 %
2000             64.774                                     11,09 %
2001             69.812                                      7,78 %   ES         -6,43 %            -4,84 %
2002             75.621                                      8,32 %
2003             76.741                                      1,48 %   FR         0,00 %      -19,10 %
2004             81.039                                      5,60 %
2005             91.453                                     12,85 %   HU         3,89 %             1,11 %
2006             95.977                                      4,95 %
2007             97.911                                      2,02 %   IT         -27,12 %    -17,85 %
2008                                                         2,47 %
2009            100.334                                    -15,56 %   NL         10,52 %            91,11 %
2010             84.725                                    -20,30 %
2011             67.523                                      4,41 %   PL         -0,83 %            -3,42 %
                 70.500                                      1,60 %
                 71.630                                               RO         0,00 %             0,00 %

2012            68.266                                     -4,70 %    SK         -3,31 %            0,92 %

2013            67.027                                     -1,81%     DK/FIN/NO  -30,00 %           -0,17 %

2014            62.587                                     -6,62%     SE         5,81 %             2,22 %

(*) As of figures show represent total market in Fep area             FEP        -6,62 %            -6,44 %  R

Production per type - 2014

Multilayer 76%           Solid 22%

                                                           Mosaic 2%

                                                                                                                13